Want to be in the loop?
subscribe to
our notification
Business News
SOCIO-ECONOMIC IN 1ST QUARTER OF 2012
+ Gross Domestic Products, 1st Quarter of 2012
2. Agriculture, forestry and fishery
The production value of this sector at 1994 constant prices in 1st quarter this year was estimated rising 3.7% from the same period last year, of which agriculture rose 3.2%; forestry 6.1% and fishery 4.9%.
a. Agriculture
As of 15/3, the country had 3,065,900 ha of winter-spring rice cultivated, equaling 99.8% from the same period last year, of which provinces in the North completed 1,106,500 ha, equaling 101.1%; provinces in the South reached 1,959,400 ha, equaling 99%. Also at this point, provinces in the South harvested 835,900 ha of spring rice, equaling only 82.2% from last year same period as this year sowing time schedule was late, of which the Mekong Delta reaped 805,200 ha, accounted for 51% of sown area and equaled 81.2% from the same period last year.
Long and damaging cold weather killed 1,500 live stocks. Bird flu broke out in many places killing 66,500 fowls. According to preliminary reports, in 3 beginning months of the year the flock of buffalos and oxen decreased by about 7% from last year’ same period, only cows rose over 10%; pigs rose 3-4%; although the flock of poultry was influenced by the bird flu but as its total number rose much at end of last year, it was estimated to rise 4-5%.
+ Production value of agriculture, forestry & fishery at 1994 constant prices
+ Agricultural production as of 15 March of 2012
b. Forestry
Total concentrated planted area in three months was estimated to reach 16,700 ha, up 4.4%; area under cultivation was 138,000 ha, up 2.2%; reforestation area was 592,000 ha, up 2.8%; decentralized planted trees were 62 million, up 2.8%; wood production was 1,045,000 m3, up 9.3%; firewood production was 7,195,000 ster, up 2.3% from last year’ same period. According to preliminary reports, as of mid-March there were 45 forest fires, that damaged 632 ha, 12 times from last year’ same period, the North-West only lost 618 ha and destroyed area was 69 ha.
c. Fishery
The total estimated fishing production in this quarter was estimated reaching 1,138,200 tons, up 3.9% from last year’ same period, of which there were 858,000 tons of fish, up 3.8%; 104,500 tons of shrimp, up 6%. The aquaculture production in the three first months was estimated reaching 511,600 tons, up 5.2%, of which there were 380,200 tons of fish, up 5% and 76,100 tons of shrimp, up 7% from the same period last year. Catching production in the quarter was estimated reaching 626,600 tons up 2.9% from last year’ same period, of which sea catching gained 581,600 tons up by 3.1%.
3. Industry
The quarter’s Industrial Production Index (IPI) rose 4.1% from the same period in 2011, of which the mining and quarrying increased by 3.2%; the manufacturing by 3.2%; the power, gas and water supply by 13.7% (IPI of the manufacturing in 2010 and 2011 was 10.6% and 13.4% respectively).
The consumption index for the manufacturing in two beginning months of the year rose 0.5% from last year’ same period.
The stock index as of 01/3/2012 for the whole manufacturing sector rose 34.9% from last year’ same period.
+ Industrial production index
+ Main industrial products
4. Service
a. Total retailed sales of consumer goods and services
As estimated, the quarter’s total retailed sales of consumer goods and services rose 21.8% from last year’ same period (if the price factor were excluded, it would be 5%). Of which the individual economic sector increased by 16.9%; the private sector by 25.7%; the state sector by 28.7%; the FDI sector by 36.7% and the collective sector by 19.2%. Among businesses, the trade rose 20.1%; the hotel and restaurant 24.6%; the service 34.3% and the tourist 14.2% from last year’ same period.
+ Total retail sales of consumer goods and services
b. Carriage of passengers and cargos
Passenger carriage in the quarter was estimated increasing 14.3% by volume carried and by 11.6% by volume traffic carried against the same period last year, of which land transport increased by 15.3% and 12.8%; river transport by 1.3% and 2.2%; rail transport by 5.5% and 5.9%; and air transport by 4.4% and 9.2% respectively.
The volume of cargos carried in this quarter was estimated increasing 10.3% by tons and decreased 3.6% by tons-kilometers against the same period last year, of which the domestic transport increased by 11.2% and 2.6%; the overseas transport decreased by 6.8% and 5.6% respectively. Land transport was estimated increasing 12.9% by tons and 10.8% by tons-kilometers, river transport by 3.9% and 2.7%; sea transport decreased by 8.9% and 7.7%; rail transport fell by 9.3% and 11.9% respectively.
+ Carriage of passengers & cargos
c. Postal and communication service
As estimated, the quarter’s new telephone subscribers reached 2.6 million, up 35.3% from last year’ same period, including 7,600 desk telephone subscribers, equaling 35.4% and 2.5 million mobile phone subscribers up 36.4% from last year’ same period. The country’s telephone subscribers as end of March was estimated to reach 134 million, up 3% from last year’ same period, including 15.3 million desk telephone subscribers, down 1.6% and 118.7 million mobile phone subscribers up 3.6%.
The country’s internet subscribers as at end of March was estimated to reach 4.2 million up 17.5% from last year’ same period; internet users were 32.1 million up 15.3%. Postal and communicational service net income in this quarter was estimated to reach 32.6 trillion dongs up 17.9% from the same period in 2011.
d. International visitors to Viet Nam
International visitors to Vietnam in 1st quarter this year were estimated reaching 1,873,700, up 24.5% from last year’ same period. Of which, visitors coming for tourist purposes were 1,112,600 up 24.5%; for business purposes 319,500 up 28.2%; for visiting relatives 334,500 up 23.2%.
+ International visitors to Vietnam
II. STABILISE MACROECONOMY AND CURB INFLATION
1. Construction, investment and development
As estimated, the construction production value (CPV) in this quarter at 1994 constant prices was 96.4% from the same period last year, of which it was 84.2% for the state sector; 99% for the non-state sector and 91.2% for the FDI sector.
The quarter’s social realized investment capital at current prices was estimated reaching 197.7 trillion dongs up 12.8% from last year’ same period and equaling 36.2% of GDP: 74.2 trillion dong from the state sector up17.6%; 71.5 trillion dong from the non-state sector up 20.4%; and 52 trillion dong from the FDI sector down 1.3%.
Of the state investment, the realized investment capital from the state budget was estimated reaching 37 trillion dongs, equaling 19% of the year plan and up 1.3% from last year’ same period: 9.5 trillion dongs from the centrally managed fund, equaling 18.6% of the year plan and up 7.9%; 27.5 trillion dongs from the locally managed fund, equaling 19.1% of the year plan and down 0.7% from the same period last year.
The attracted FDI from 1/1 to 20/3/2012 reached USD 2,634.9 million, equaling 63.6% from last year’ same period, including USD 2,267.4 million registered capital of 120 newly licensed projects, equaling 44.4% by number of projects and 77.2% by registered capital from last year’ same period; USD 367.5 million additional registered capital of 29 times of licensed projects from previous years. As estimated, realized FDI in the quarter reached USD 2.5 billion, reduced 0.8% from last year’ same period.
Of total registered FDI capital in this quarter, the real estate reached USD 1,200 million from 02 newly licensed projects; the manufacturing gained USD 1,174.5 million: USD 816.5 million of 51 newly licensed projects and USD 358 million additional registered capital; the transport and warehouse achieved USD 180 million from 01 newly licensed project.
+ Realized development investments under State Budget
+ Licensed FDI projects, 01/01- 20/3/2012
2. Government revenues and expenditures
As estimated, total Government revenues from beginning of the year to 15/3/2012 reached 136.9 trillion dongs, equaling 18.5% of the yearly estimate, of which domestic revenues were 89.5 trillion dongs, equaling 18.1%; revenues from crude oil 19.5 trillion dongs, equaling 22.4%; from import-export 27.1 trillion dongs, equaling 17.6%. Of the domestic revenues, collecting from state enterprises was equal to 22% of the yearly estimate; from FDI enterprises (excluding crude oil): 16.3%; from non-state industrial, commercial and service taxes: 17.8%; taxes imposed on high-income persons: 17.2%; environment protection tax: 18.4%; other fees: 12.7%.
As estimated, total Government expenditures from beginning of the year to 15/3/2012 reached 164.9 trillion dongs, equaling18.3% of the yearly estimate, of which spending for investment and development was 31.4 trillion dongs, equaling 17.4% (for capital construction investment only was 30.7 trillion dongs, equaling 17.6%); for economic and social development, national defense and security, state management, Party and unions: 111.4 trillion dongs, equaling 18.5%; for paying debts and aids 22.1 trillion dongs, equaling 22.1%.
3. Export and import of goods and services
a. Exports
This quarter’s export turnover was estimated reaching USD 24.5 billion, rose 23.6% from last year’ same period: the domestic economic sector gained nearly USD 9 billion, closely to that in last year’ same period, the FDI sector (including crude oil): USD 15.5 billion, rose 43.1%. If the factor of high prices were excluded, this quarter’s export turnover would rise 12% from last year’ same period.
There was a change in the structure of exported goods: the proportion of industrial and mineral goods rose from 37.3% in 1st quarter last year to 44.9% in this quarter; light industrial and handicraft goods slightly declined from 36.3% to 35.5%; agricultural and forest goods decreased from 20.7% to 14.5%; aquatic products slowed down from 5.7% to 5.1% respectively.
About markets for exportation in this quarter, EU was the largest market with estimated export turnover of USD 4.5 billion, up 29% from the same period in 2011; next came to the United States with USD 4.1 billion, up 16.5%; ASEAN: USD 3.6 billion, up 21%; Japan: USD 2.9 billion, up 45%; China: USD 2.6 billion, up 18.1%.
+ Exports
b. Imports
This quarter’s import turnover was estimated reaching USD 24.8 billion, up 6.9% from last year’ same period, of which the domestic economic sector gained USD 11.7 billion, down 10.9%, and the FDI sector with USD 13 billion, up 30.3%.
There was also a change in the structure of imported goods: the proportion of means of production rose from 90.4% in 1st quarter last year to 92.7% in this sector, of which machinery and equipment rose from 27.6% to 33.9%; raw materials declined from 62.8% to 58.8%; consumer goods reduced from 8.4% to 7.3%. Privately, gold was not imported in this quarter while the import turnover proportion of this item in the same period last year was 1.2%.
About markets for importation in this quarter, China was still the largest market with USD 5.4 billion import turnover, up 6.5% from the same period in 2011; next came to ASEAN with USD 4.9 billion import turnover, up 2.8%; Republic of Korea: USD 3.4 billion import turnover, up 20%; Japan: USD 2.6 billion import turnover, up 14.8%; EU: USD 1.9 billion import turnover, up 25%.
The quarter’s trade deficit was estimated at USD 251 million, equaling 1% of total export turnover, of which the domestic economic sector had trade deficit of USD 2.75 billion; while the FDI sector had trade surplus of USD 2.5 billion.
+ Imports
4. Price indexes
a. Consumer Price Indexes (CPI)
March’s CPI slightly rose 0.16% from February, of which the impact from adjustment of raising gasoline price by nearly 10% made CPI rise 0.08%. CPI for grain food and foodstuff in this quarter reduced much from the same period in 2011, of which grain food decreased by 1.21%; foodstuff by 1.25%. Among groups of goods and services, housing and construction material had highest pace of 2.31%; education rose 1.11%; transport rose 1.08%. Other groups with much lower or decreased CPI were family appliances 0.55% up; medicines and health service 0.48% up; textile, hats and footwear 0.41% up; culture, entertainment and tourist 0.36% up; drinks and tobacco 0.16% up; catering and related services 0.83% down; postal and communication service 0.02% down.
March’s CPI rose 2.55% from 12/2011 and 14.15% from last year’ same period. This quarter’s average CPI increased by 15.95% as compared to that in the same period in 2011.
b. Producer price indexes (PPI)
PPI for agricultural, forest and fishing products in this quarter rose 0.26% from the previous quarter and 21.25% from last year’ same period, of which PPI for agricultural products reduced 1.46% and rose 19.89%; forest products rose 3.36% and 14.55%; fishing products rose 6.81% and 27.47% respectively. PPI for industrial products in this quarter rose 3.16% from the previous quarter and 16.81% from last year’ same period, of which PPI for mineral products rose 19.22% and 38.86%; manufacturing products rose 0.75% and 13.43%; power generation and supply rose 5.05% and 8.40%; water rose 13.60% and 22.87% respectively.
Raw materials price indexes (RMPI) for domestic production in this quarter rose 2.31% from the previous quarter and 18.92% from last year’ same period, of which RMPI for some industries had higher pace than the previous quarter were electronic, computing, optical products 6.92% up; textile, garment, leather and related products 5.77% up; gas, warming water, steam and air-conditioner products 3.38% up.
Transport charge indexes (TCI) in this quarter rose 5.94% from the previous quarter and 18.71% from last year’ same period, of which TCI for passengers rose 11.01% and 33.05%; TCI for cargo rose 1.78% and 7.87%; warehouse and transport supporting service costs rose 4.21% and 13.81% respectively. TCI for transport branches were as follows: TCI for rail rose 6.06% from the previous quarter and 38.12% from last year’ same period; TCI for land rose 2.01% and 11.87%; water-way rose 2.54% and 9.74%; airway rose 19.85% and 46.64%; warehouse and transport supporting service rose 4.21% and 13.81% respectively.
d. Export-import price indexes
Export price indexes in the quarter fell 1.75% from the previous quarter and rose 4.57% from last year’ same period. Import price indexes in the quarter fell 1.04% from the previous quarter and rose 10.56% from last year’ same period.
+ Consumer price indexes, gold & USD price indexes, March 2012
+ Producers’ price indexes for agricultural, forestry and fishing Products in 1st Quarter of 2012
+ Producers’ price indexes for industrial products In 1st Quarter of 2012
+ Price indexes of materials used for production 1st Quarter of 2012
+ Export price indexes in 1st Quarter of 2012
+ Import price indexes, 1st Quarter of 2012
+ Transport charge indexes, 1st Quarter of 2012
III. SOCIAL ISSUES
1. Labor and employment
According to preliminary data from the labor and employment survey in 1st quarter of 2012, the country’s labor forces aged 15 and above were 52.2 million, rose 827,300 from the average labor forces in 2011. Of the total, men were 26.9 million, rose 400,900; women were 25.3 million, rose 426,400. Laborers within the labor working age group over the country were 46.9 million, rose 403,600 from the average number of laborers last year, of which men were 25 million, rose 148,300; women were 21.9 million, rose 255,300.
2. People’s life
According to 2011 Household Living Standard Survey, the country’s general poverty household rate was 12.6%, decreased 1.6 points percent from 2010, of which it was 5.1% for urban area and 15.9% for rural area. Poverty rates in 2011 for regions were as follows: the Mid-land and Northern Mountainous Region 26.7%; the Central Highland 20.3%; the North Center and Central Coast 18.5%; the Mekong Delta 11.6%; the Red River Delta 7.1%; the South East 1.7%.
According to local reports, 5.6 million gifts with total value of 1.8 trillion dongs have been provided to poor families since the beginning of the year.
The life of farmers in rural area has been bit by bit improved. In 3 beginning months of the year, the country had 200,400 times of households suffered from food shortage, reduced 33.4%, in proportion to 827,100 times of hunger persons, reduced 32.8% from last year’ same period. To overcome the problem, administrative levels from central to local have provided hunger families with 17,800 tons of food and 22.4 billion dongs. Besides that, local governments have provided 22,400 tons of rice from the national reservation resource to hunger people during the Dragon Lunar New Year and between crops period.
3. Education and training
At the beginning of 2011-2012 school year, the country had 13,384 kindergartens, raised 706 schools from the previous school year; 15,337 primary schools, raised 95 schools; 10,243 junior secondary schools, up100 schools and 2,433 senior secondary schools, up 145 schools. Teachers for various levels also increased against 2010-2011 school year, of which kindergarten teachers were 181,900 persons, rose 15.5%; schooling teachers who directly taught were 829,600 persons, rose 1.4%: 366,000 primary teachers, up 2%; 313,500 junior secondary teachers, up 0.3% and 150,100 senior secondary teachers, up 2.3%. At the above period, the country had 3.4 million children going to preschools, rose 11.1% from the previous school year; 7.1 million primary pupils, up 1.4%; 4.9 million junior secondary pupils and 2.8 million senior secondary pupils. The number of secondary pupils did not change much as compared with that in 2010-2011 school year. As of end of March, 59 per 63 provinces and cities over the country met standard for compulsory primary education within right age group and 63 per 63 provinces and cities met standard for compulsory junior secondary education.
In 2011-2012 school year, the country had 2,478,000 university and college students, reached the rate of 280 students per 10,000 persons and rose 14.6% from the previous school year; 734,000 intermediate students, rose 7%.
4. Epidemic diseases and food poisoning
In this quarter, the country had 7,200 cases of hemorrhagic fever (5 died); 68 cases of virus encephalitis; 12 cases of meningococcus (2 died); no cases found infected with A (H1N1) flu. More 987 cases infected with HIV found in March, bringing HIV-infected persons over the country as of mid-March 2012 to 251,900, of which 102,200 turned to AIDS and 52,500 persons died of AIDS. There were 16 cases of food poisoning, infecting 360 persons, of which 3 died in the quarter.
5. Games and sports
In high performance sports, up to present the country has had 7 sports persons approved to officially participate in the qualification round for Olympic London, 2012. Additionally, the Sports and Gymnastics has successfully held 15 domestic events, 01 international event and participated in 22 international matches. Particularly, in international matches held in Vietnam, the Vietnamese team awarded championship for women in 2nd HDBank International Chess, 2012 and second-best title at VIth Binh Dien VTV International Volley- Ball Cup.
6. Traffic accidents
Generally in two beginning months of the year, the country had 1,940 cases of traffic accident, killing 1,665 persons and injuring 1,481 others. As compared to the same period last year, cases of traffic accident decreased by 21.2%; the death by 19.7% and the injured by 23.7%. On average, each day in this period, the country had 32 cases of traffic accident, killing 28 persons and injuring 25 others.
7. Natural calamity
Long and damaging cold weather together with tropical low pressure and heavy rains, flood tide happened in the quarter impacted on People’s life and production in many places over the country. Calamity made 100 houses collapsed and swept away; 3,100 houses inundated; nearly 7,000 ha of rice and vegetables flooded and damaged; 6,300 ha of rice, rice seed and vegetables suffer from empty loss; over 1,500 animals die. Total losses caused by calamity were estimated at 62 billion dongs.
GENERAL STATISTICS OFFICE
Related News

VIETNAM ECONOMY INVESTMENT
GREEN ECONOMY, DIGITAL ECONOMY BREAKTHROUGH OF VIETNAM-CHINA TIES: PM
Addressing a Hanoi seminar with 19 Chinese groups operating in green economy and digital economy, the leader said the meeting, the first of its kind, aims to materialise high-level perceptions reached by Party General Secretary Nguyen Phu Trong and Party General Secretary and President of China Xi Jinping, who agreed to build the Vietnam-China community with a shared future.

VIETNAM ECONOMY INVESTMENT
CONSUMER CONFIDENCE IN ECONOMIC RECOVERY REACHES FIVE-QUARTER HIGH
Vietnam's GDP expanded by a healthy 5.66 per cent in the first quarter of 2024, marking the strongest first-quarter growth since 2020. While slower than the previous quarter's 6.7 per cent growth, this momentum indicates the country is on track to achieve its 2024 economic targets.
VIETNAM ECONOMY INVESTMENT
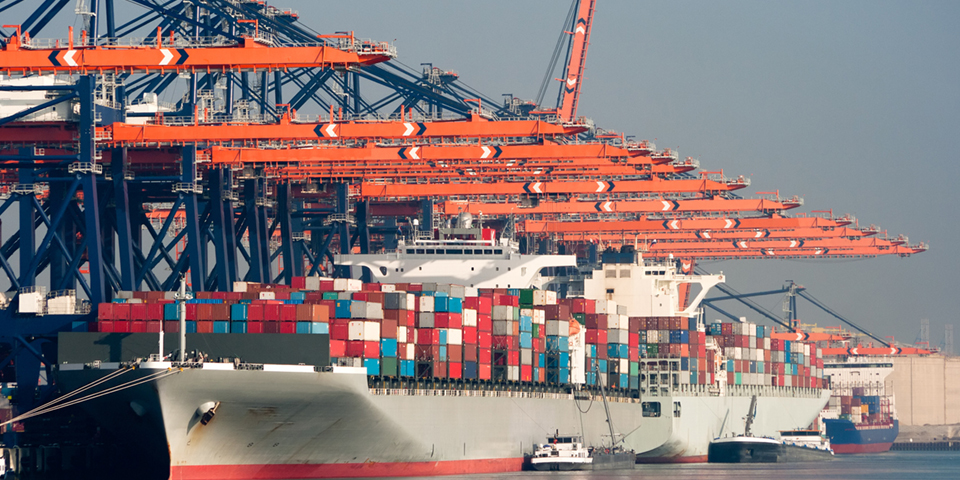
THE VIET NAM IMPORT-EXPORT REPORT TO BE RELEASED THURSDAY
In particular, it includes an itemised import and export report, in specific markets and also includes an overview of all State management activities and policy mechanisms related to the import, export market along with details of all the legal documents issued in the year.
BANKING / FINANCE / INSURANCE / TAX
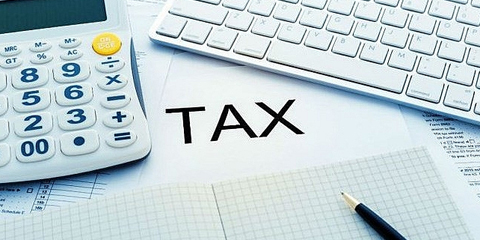
TAX AND FEE SUPPORT HINGES ON MPI PROPOSAL APPROVAL
“Business and production activities of enterprises remain in big difficulties. Domestic purchasing power has reduced and people are tightening their belts,” the MPI stated. “Demands in the domestic market are still standing at a low level, while manufacturing and processing enterprises have low competition. These are among the biggest difficulties.”
GARMENT / TEXTILE
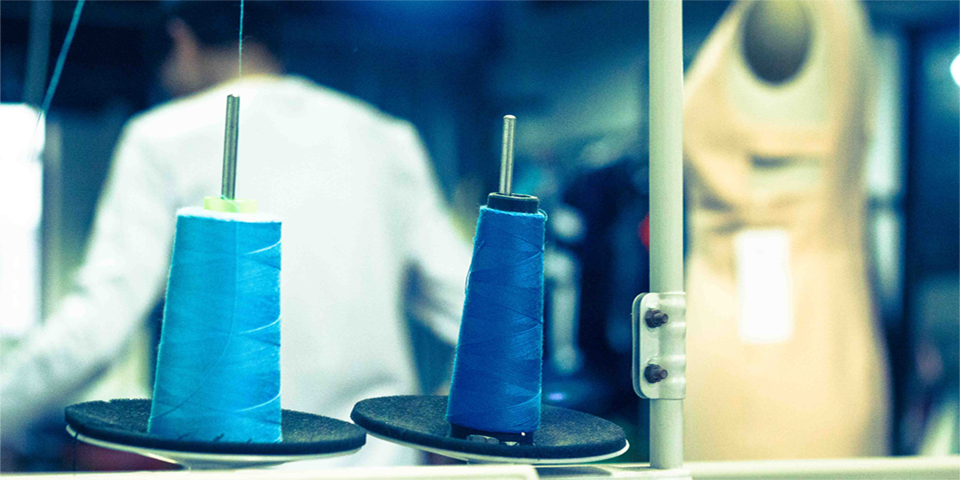
VIETNAM’S TEXTILE SECTOR BRINGS IN $37 BILLION IN FDI
The foreign-invested enterprises play an important role in the textile and garment sector, contributing 65 per cent to the sector’s total export turnover. Major investors mainly come from South Korea, Taiwan, Hong Kong, and China. Among them, South Korea is the largest foreign investor in Vietnam’s textile and garment sector.
PROPERTY / INDUSTRIAL ZONE
FDI FLOWS STRONGLY INTO MANUFACTURING, REAL ESTATE
According to the General Statistics Office (GSO), the total FDI disbursed in Vietnam in the first four months of this year reached an estimated 6.28 billion USD, up 7.4 per cent year on year, the highest four-month amount in the past five years.
Events Sponsors